Mobile alerting with tracking & escalation for Grafana
![]() Why Enterprise Alert
Why Enterprise Alert
Grafana is a multi-platform open source analytics and interactive visualization software available since 2014. It provides charts, graphs, and alerts for the web when connected to supported data sources. Performance monitors are easy to configure, and notifications channels are configured with just a few clicks. Enterprise Alert ensures that all on duty members receive, acknowledge and resolve critical alerts, all from their smartphones. With persistent notifications and escalation chains there will never be a critical alert that goes unattended. Enterprise Alert also offers ad-hoc collaboration between team members for each alert, so Subject Matter Experts can be looped in to help resolve issues.
![]() How it Works
How it Works
Enterprise Alert team webhook establishes connection with Grafana to enable mobile notification and alerting capabilities for operational and network teams.
![]() Integration Capabilities
Integration Capabilities
- Forwards Grafana incidents to Enterprise Alert for mobile alerting
- REST API integration
- Staff can acknowledge and take ownership for critical incidents that occur
- Communicate within an alert to address a problem
- Alerts are escalated in case of no response
- On-call scheduling to alert the right people at the right time
![]() Scenarios
Scenarios
- Application Performance Monitoring
- Server Resource Monitoring
How to Integrate
In our example we are using Grafana to monitor the uptime of critical applications. We are setting up a webhook to send alerts to the Enterprise Alert team when the site is unreachable.
Forwarding Grafana Events to Enterprise Alert
- First, we need to make sure that Grafana was the WorldPing plug in.
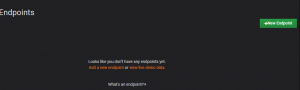
- Now we need to set an endpoint to monitor.
- Enter the URL of the application you want to monitor and click Discover. The discovery will take place and then click Add.
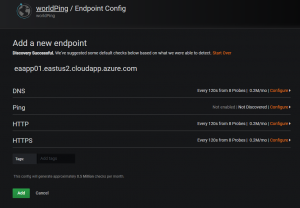
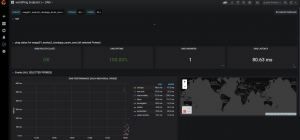
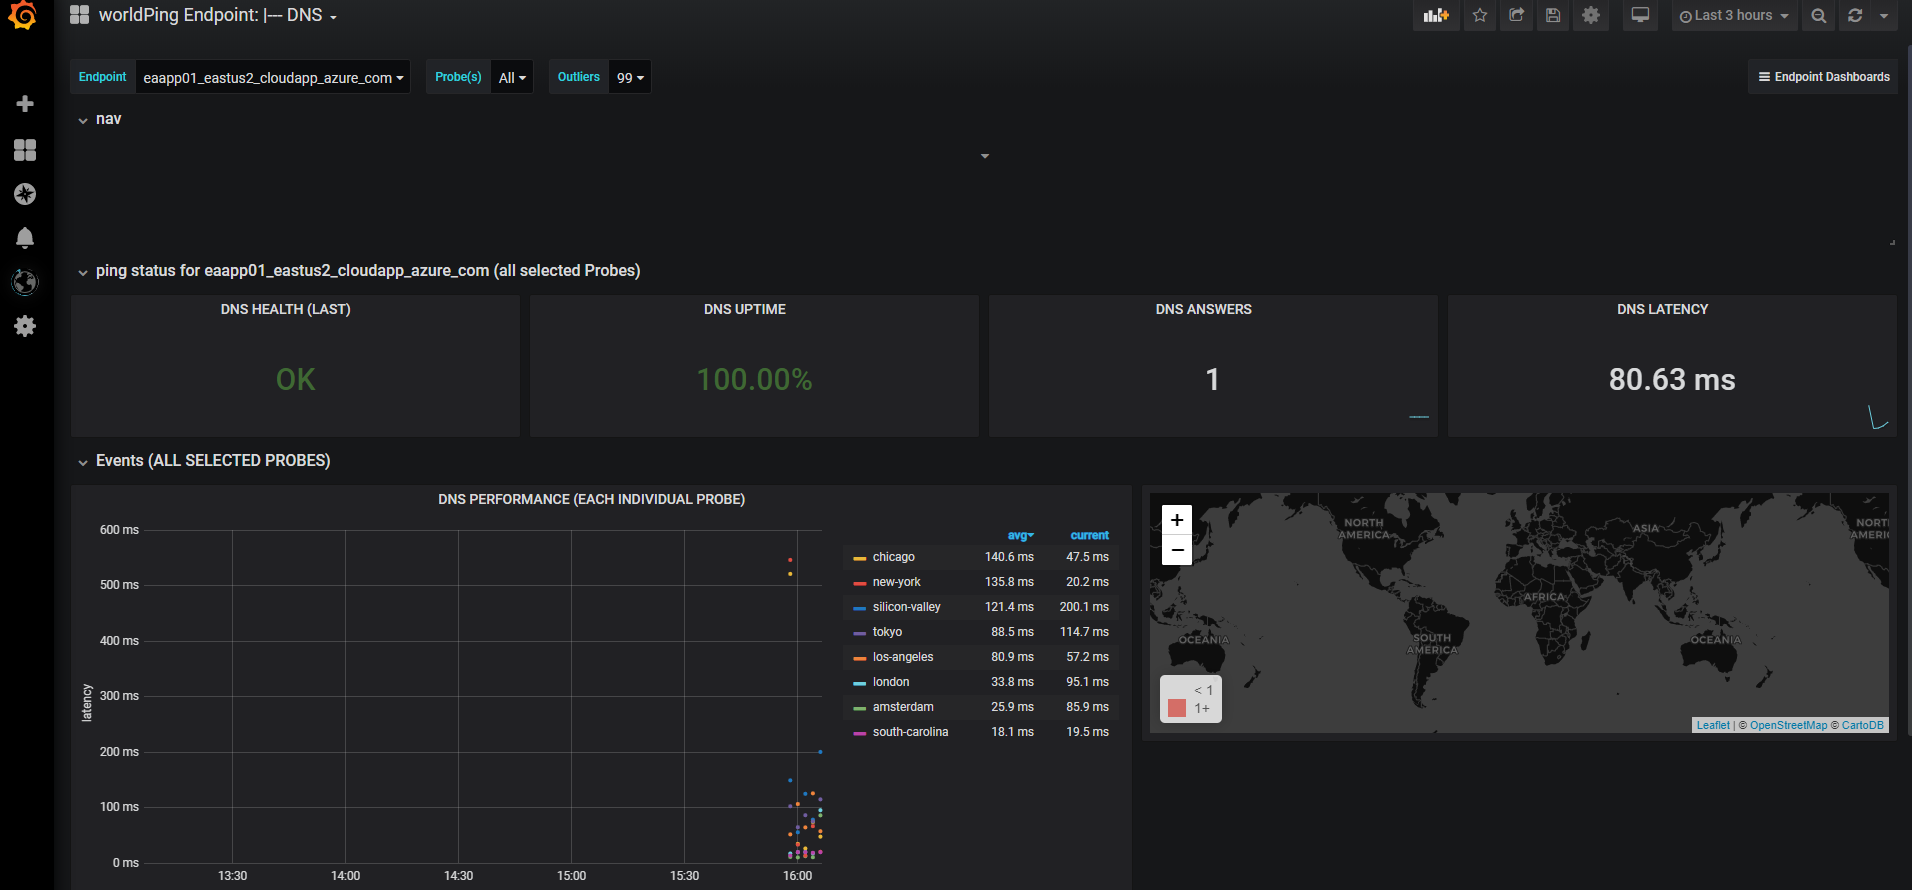
- Once the end point is probed you will start seeing data display on the dashboard.
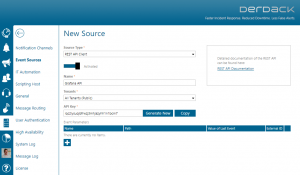
- You need to create a REST API event source so that Enterprise Alert can receive data. From the Alerting section click on Event Sources > Create New
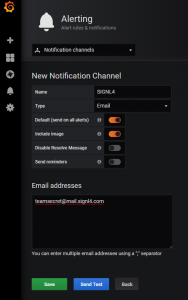
- Click on the Bell Icon for Alerting and select Notification channels. Click Add New Channel
- Input the Webhook URL for the Enterprise Alert REST API created earlier. This is a combination of the REST API link from the Enterprise Alert dashboard and the REST API key. Here is an example
http://your-server-name/EAWebService/rest/events?apiKey=APIKEY
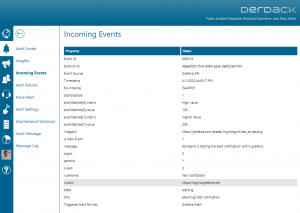
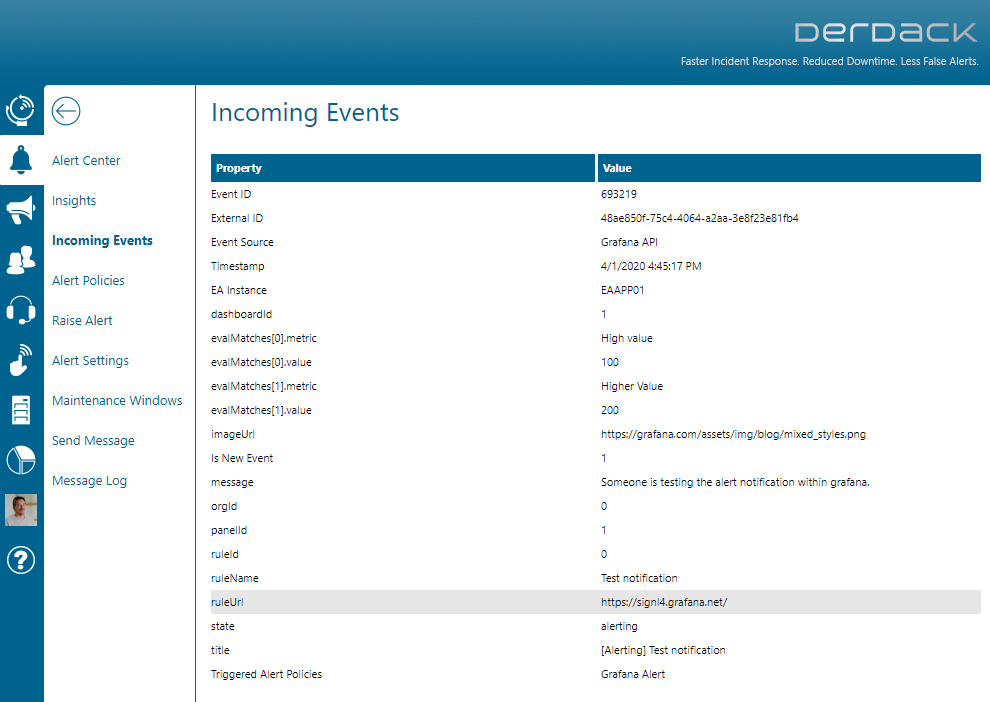
- Now once the site is unreachable, Grafana will send JSON format via POST to Enterprise Alert.


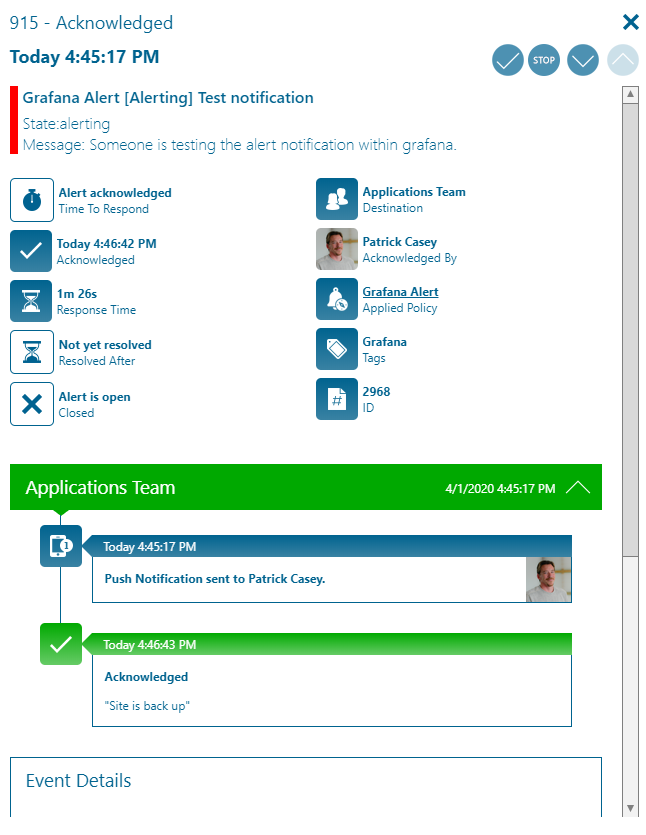
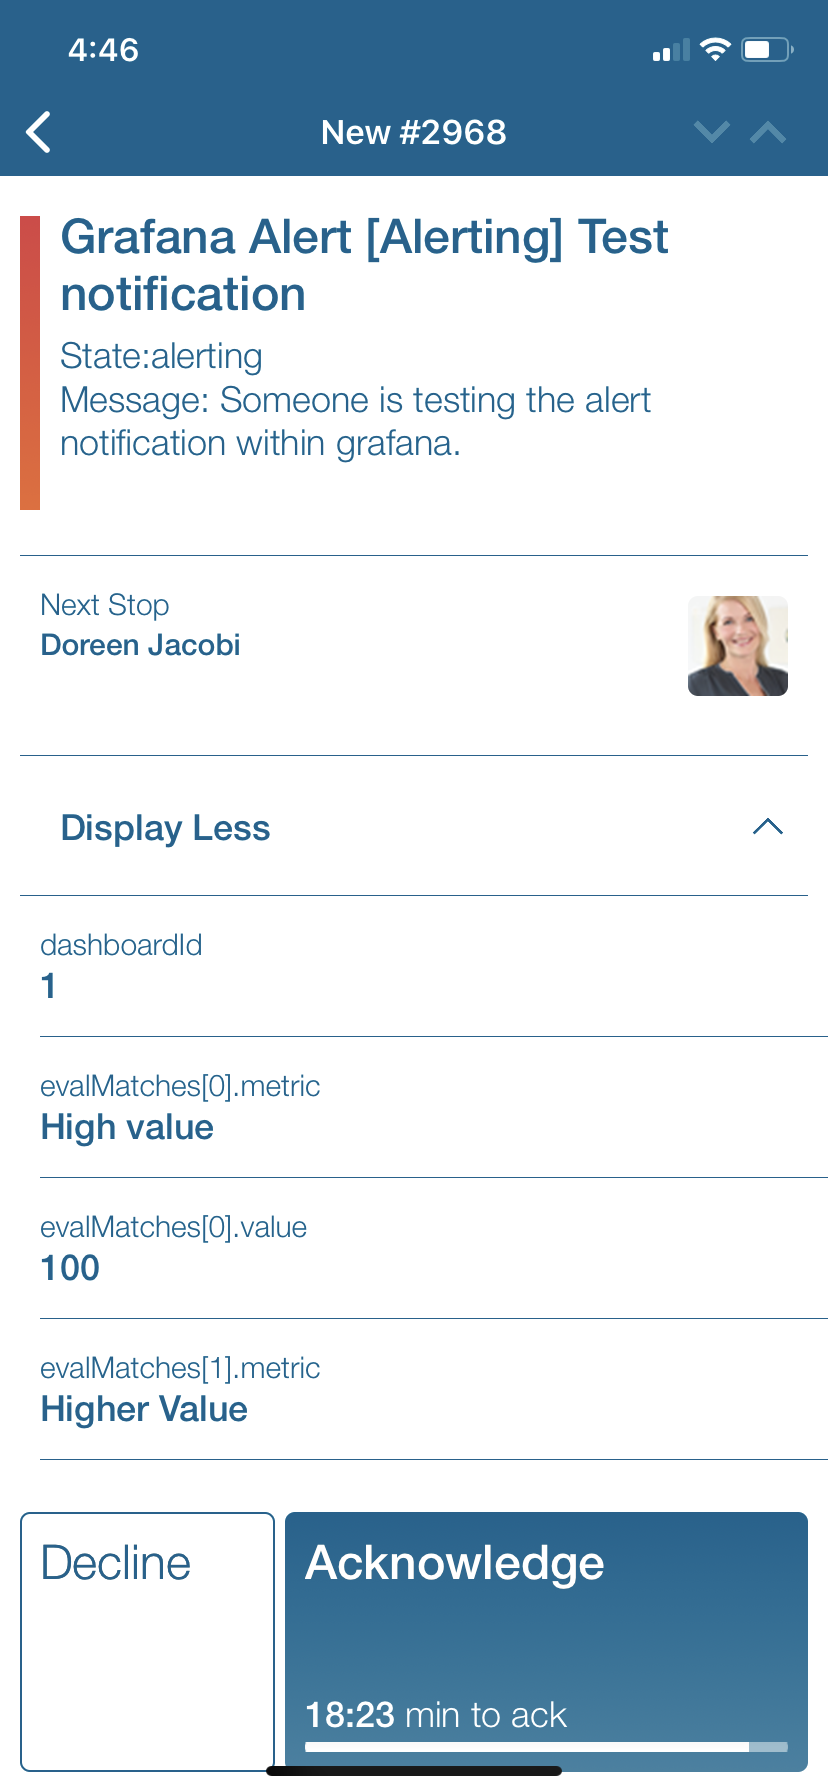
Notifications within the Enterprise Alert mobile app
Enterprise Alert comes complete with a mobile app allowing for all critical alert details to be seen from anywhere. Users can acknowledge and take ownership of alerts and with remote actions, even resolve them. Team members collaborate with their peers so that even if an on-call person is not the SME, that person is easily within reach via voice call, text or email.
A centralized Alert Center can be viewed from the web portal. All alerts, whether active, overdue or closed are visible to EA admins. Ownership and even delegation is as easy as drag-and-dropping the alert to the person/team.