Enterprise Alert is the central hub for managing critical alerting, notifications, and remediation needs. It is a database-driven application and most of the time, once set up and configured, it just silently does its job in the background. Where we have customers frequently adapting and maintaining notification profiles, event sources, workflows, or channels in our product – there are also those that set up Enterprise Alert once and then hardly “ever touch their running system” again. The high degree of automatization that comes with our system makes it possible. The new health check functionality will make it even easier to do so.
Regardless of how often you interact with Enterprise Alert and mainly because of the majority of work being done in the background – customers often forget that performing regular maintenance on Enterprise Alert and on the respective database(s) is crucial to ensure that everything can run seamlessly. Everything that goes in and out of Enterprise Alert is logged and stored in the database linked to our system because this is how you achieve full transparency and audit trailing for your internal reporting. If your database is reaching capacity and responses are becoming exceedingly slow – it is definitely time for some maintenance. With Enterprise Alert being a notification system – ideally, you are notified before you feel any effects of your database reaching capacity or your disk space running low.
What did we do to make your life easier?
With every release and every patch that we provide, we aim to improve our performance and ease your day to day tasks even more. Allowing you to focus on what is important and to rely on our system for your most critical communication. Our latest patch comes with an extended kernel capability – automatically checking the max DB and hard disk size. This health check comes with new parameters (DatabaseFreeCheckLevelsInMB, DiskFreeCheckLevelsInMB) available in the logman.xml. If the configured thresholds are met the health check function will then generate a warning message.
To illustrate this let’s assume your DB has a total size of 10GB and you want to get a warning message when you get close to that capacity maximum. With the new patch, what you do is, you set the value in the logman.xml like this:
<value>500;300;100</value>
Now if the amount of free disk space runs below 500MB you get your first health check warning message. If it goes below 300MB your second and your 3rd message triggers below 100MB. You now receive 3 health check warning messages allowing you to adapt regardless of how often you schedule system or database maintenance and avoiding slow processing of your critical communication.
How does that look in the field?
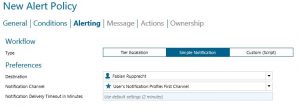
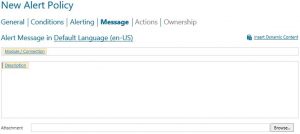
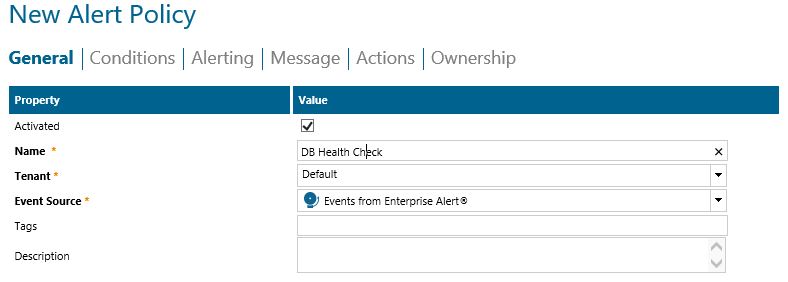
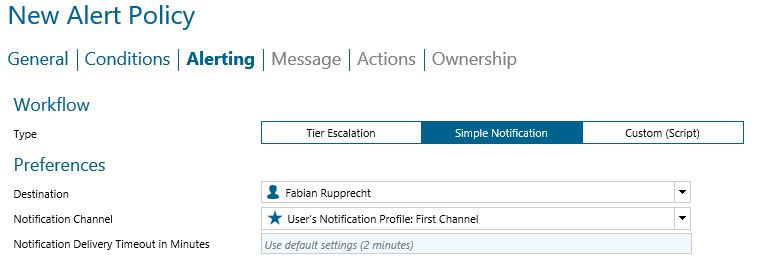
In order to benefit from the added logging, you will want to set up an alert policy to get notified.
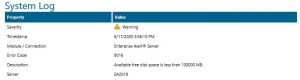
- To simulate the issue you will just have to set the threshold high enough in this case 100GB. Once the threshold is set and the kernel running again a warning event will show up within the Enterprise Alert system log.
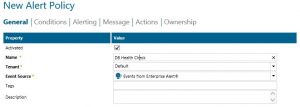
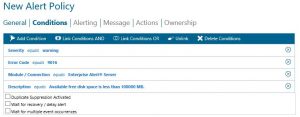
- Creating an alert policy from the event is the best way to ensure that no threshold goes unnoticed. In the following screenshots is an example of an alert policy.


Summary
Enterprise Alert is your primary weapon when it comes to ensuring that no critical information gets lost and that people who need to be in the know, can get their notifications on critical situations within your organization. Enterprise Alert is your last man standing and needs to be the most reliable solution you have. A redundant, HA setup is recommended, but a well-maintained and performant database is just as crucial. While database monitoring is often already taken care of, the described extra step and regular health check straight from the application can make a big difference in raising awareness with the administrators, enabling them to take action to remediate problems before they even become an issue.
If you have any further questions on this topic please feel free to contact us under support@derdack.com.