The benefits of using the correct reporting, analytics and information delivery capabilities can transform an organization. Having access to timely data, reporting, and analytic capabilities helps to ensure the ability to get the right data to the right users at the right time. Having the ability to pull any information that your business needs at any given time allows for the flexibility to get the information for your business when and where it is needed.
Let’s look at some PowerBI created reports:
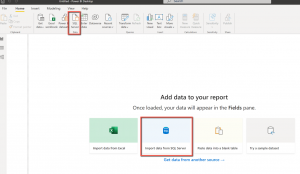
Enterprise Alert saves all alerting information into a local Database that can be used to create reports inside of PowerBI. Inside of PowerBI there is an option to create reports directly from a SQL database.
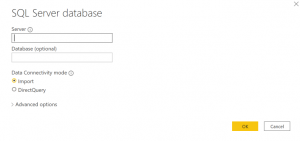
Selecting that option will bring up a connection box to allow PowerBI to connect to your Database.
Once this connection is established you can create any report you wish to see using the Enterprise Alert Database.
To get you started we have documented how to create a number of, below are the reports and the Database tables used to create them.
- Alert Counts
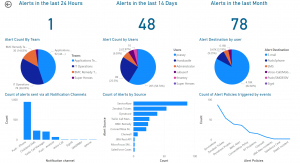
Our first report is actually 3 reports, these reports show the number of alerts that have been raised in a certain time frame. This report allows you to see spikes in alerting numbers over a set period of days.
- Alert Count by Teams
Our second report is a count of all alerts sent to each team inside of Enterprise Alert. This report allows you to see if one team is taking a larger than normal load for alerts while another team is not receiving any.
- Alert Count by Users
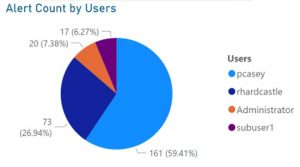
The third report we created is the Alert Count by Users report. This report will allow you to see which of your users are receiving alerts and to know if one user us not pulling his weight while another shoulders all of the burden.
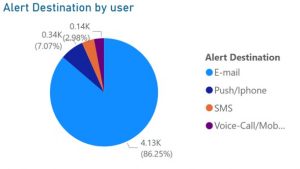
- Alert Destination by User
Our Fourth report is the Alert Destination by User report. This report allows you to quickly look at what notification channels are being used by your users, which can enable to you make a decision on if you have one user that is being notified in one way vs the rest of a team being notified in another. Using this in conjunction with the above report will allow you to make decisions on how best to notify users.
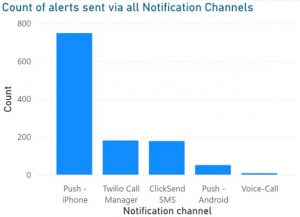
- Count of Alerts sent via All Notification Channels
The fifth report we created is the Count of Alerts sent via All Notification Channels. This report allows you to show count of all alerts being sent by each notification channel, which will in turn enable you to make informed decisions on which channels need to be upgraded and which ones can be disable from not being used.
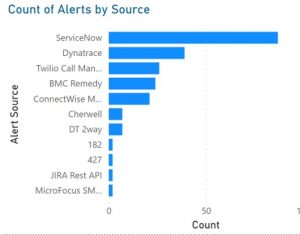
- Count of Alerts by Source
The next report we created is a count of all alerts created by each event source in your system. This allows you to know which event source inside of Enterprise Alert is sending more and more alerts into the system, this can allow you to focus on where issues are arising and help stop them before they start.
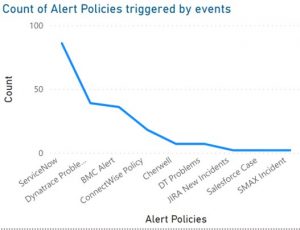
- Count of Alert Policies Triggered by Events
The final report we created is a count showing how often each alert Policy is being activated by incoming events. This report will allow you to see if one Policy is generating to many alerts and is maybe its filters are to general, or if another is not sending out any alerts and is maybe to specialized.
SUMMARY
Using PowerBI in conjunction with your Enterprise Alert Databases allows you to create reports to quickly show data and find patterns of incoming events so you can quickly react to spikes in events and help solve issues even faster. In addition the ability to show how your alerts are being sent to users will allow you to prioritize upgrades to the affected notification channels to stay ahead of load issues, or even eliminate cost by having users switch from one notification channel to another.
For a video detailing our use of PowerBI reports and how to create the above reports go here: https://youtu.be/wXCeH6SwkOE
Schedule your personal demo today to see how Callouts can increase the speed and efficiency of your emergency notifications. https://www.derdack.com/request-a-demo/

